- A semester-long, capstone project for my MS in Analytics from Georgia Tech
- Here are reports detailing the methodology and results.
- Major tasks
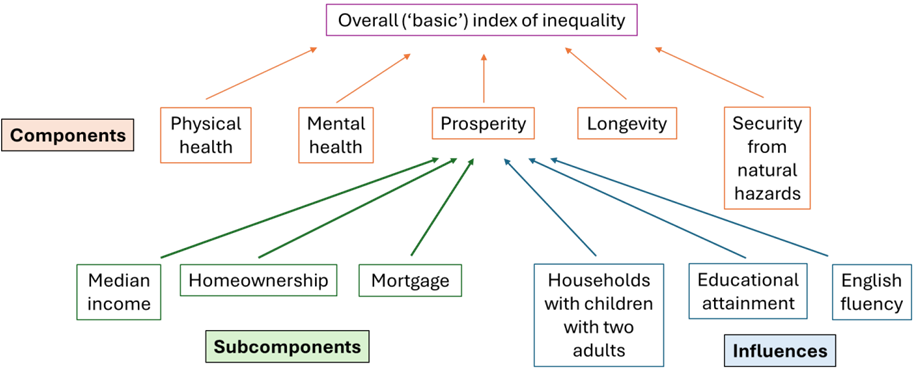
- Created a quality-of-life index using five basic outcomes
- Identified components of and influences on the outcomes
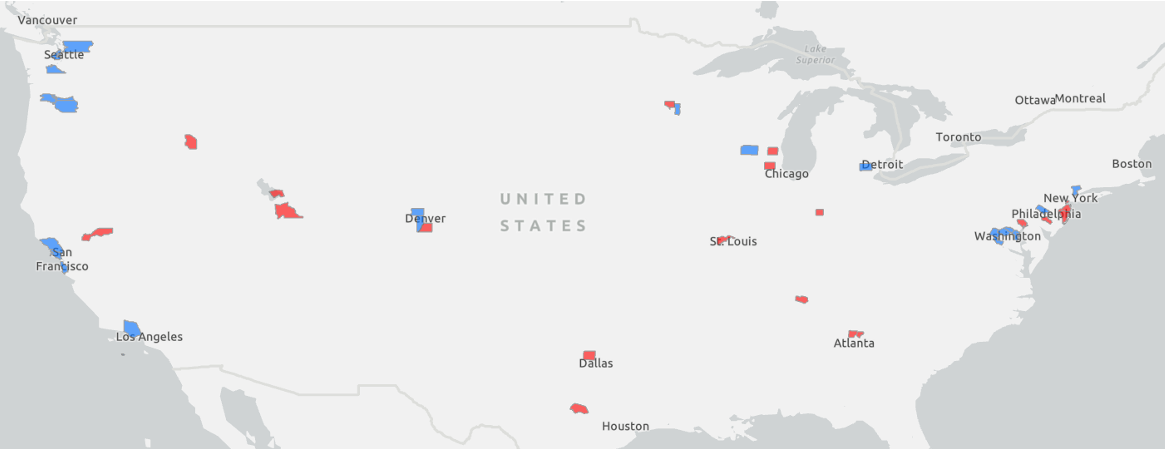
- Calculated the index for each census tract in the U.S., normalized at the county level
- Clustered counties to find statistical peers for Anne Arundel County
- Identified ideological peers and contrasts for Anne Arundel County from within its cluster
- Compared counties and groups of counties regarding the quality-of-life index, its components, and (due to time limitations) a subcomponent
- Comparing levels of inequality, including recent changes in this
- Comparing association with ethnicity, including recent changes
- Created a quality-of-life index using five basic outcomes
- Conclusion, in general terms
- Relatively progressive counties, such as Anne Arundel, did experience a consistently different pattern compared to relatively conservative ones with regard to inequality and the analytical salience of ethnicity.

- Datasets
- More than 30 from external sources, plus intermediate products
- Sources
- The U.S. Census Bureau (most)
- The American Communities Project
- The U.S. Religion Census
- The CDC’s PLACES and USALEEP projects
- Preparation included converting and interpolating data from the census tract boundaries used in 2010 to those used in 2020
- Analytical techniques
- Clustering
- K-means
- Spectral
- Measuring inequality
- Gini ratio
- Estimating association with the ethnic distribution
- Correlation
- Elastic net regression
- Random forest regression
- Hypothesis testing
- Mann-Whitney’s U
- Testing analytical tools for bias
- Generated pseudorandom data to test whether changes in census tract number and average size inherently affected Gini and elastic net results
- Found a systematic pattern of bias in each
- Calculating an inequality index for the vast majority of census tracts and counties in the U.S.
- Generated pseudorandom data to test whether changes in census tract number and average size inherently affected Gini and elastic net results
- Clustering

- Software
- Coded in Python (VS Code) and R (RStudio)
- Mapped in ESRI’s ArcGIS Pro
- Version control using GitHub
- Other research
- Discussion with subject-matter experts
- Reading research articles about the issues covered
- Comparison with similar endeavors