
- Poster (divided into slides) here
- Group project that I designed and led. I also identified the data and software, created the vulnerability index, and troubleshot all aspects.
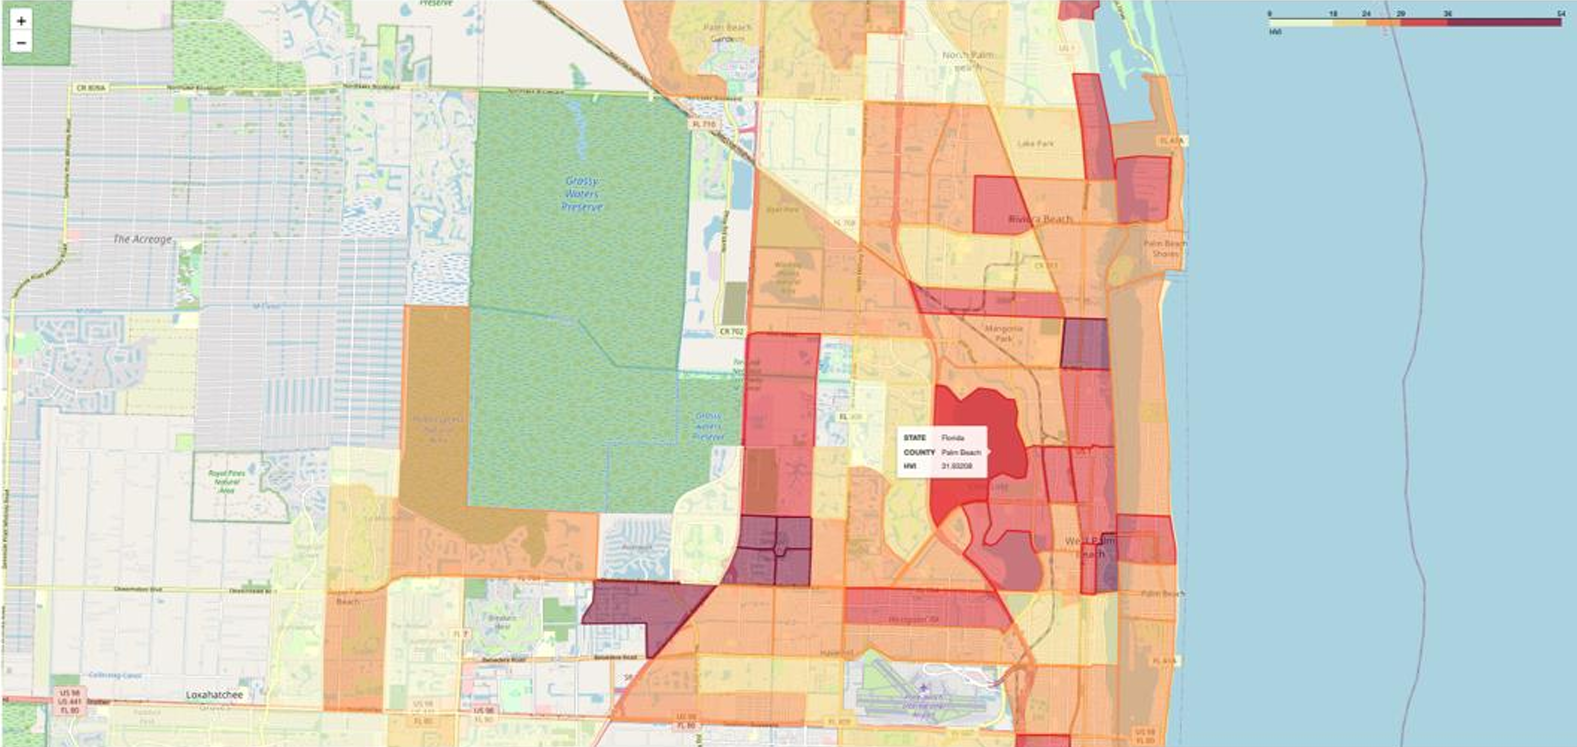
- Developed a decision tree that selected urban census tracts with low tree cover and high predicted heat, ranked census tracts by their residents’ vulnerability to heat, and then mapped the results.
- Intended user: government or NGO specialist planning a program to reduce the effects of extreme heat events across the U.S.
- Data from USGS satellite analysis, Census Bureau tables, and the First Street Foundation’s Heat Factor predictions
- Coded in Python, GeoPandas, D3.js

